Learning about Python performance optimisation
27 Jun 2022
At work I primarily develop web applications, where performance tends to mean efficient interaction with a database, caching, parallelising API calls or offloading an expensive operation to a background task. Rarely do I encounter what I’ve seen referred to as “hot loops”–bits of code that you run thousands or millions of times in a single process, where even the smallest optimisation can offer huge gains–but I’ve been reading Micha Gorelick and Ian Ozsvald’s book High Performance Python and was looking for an excuse to try out some of the things they talk about. Then I realised that I already had a personal project that would be the perfect guinea pig!
The Team Topologies book talks a lot about the cognitive load that an engineering team can handle, and I was interested in finding a way to measure that. I quite quickly came across the vast body of work on code complexity, which is a subject matter for another post but if you’re interested you could get a brief overview from the Radon docs. While reading about the subject I came across another approach to measuring code complexity that didn’t seem to have a related Python package, so I wrote one. I won’t go into the details too much, but its basic job is to scan the code in one or more Python files and spit out a number that represents the file’s code complexity. When I wrote it I tested it on a number of repos that I had on my local machine, but I never really put it through its paces and looked for ways to make it faster, until now.
Jump to heading Caveats
Before we proceed, I need to give a handful of general caveats to keep in mind when talking about performance:
- the numbers you will see are from my machine, and won’t necessarily be replicable on your own;
- most profilers will add a considerable amount of overhead to your code, so don’t pay attention to the absolute numbers they report, do pay attention to the magnitude of any changes you see; and
- Python is constantly improving, so something that’s slow for me today may not be slow for you when you read this!
Jump to heading Baseline
My code would likely scan a single Python file too quickly for me to tell whether a change I made was an improvement or not. To be able to see any performance improvements I needed to be able to run my code across a lot of files, so I chose the Django repo because it clocks in at around 500MB, 97.2% of which is Python files according to Github.
To start with I just wanted a baseline, so using the time module from the standard library I timed my package running over the Django project, a little over 13 seconds. I was surprised it was that fast, to be honest!
Next up was running cProfile, also from the standard library. By default this prints its results to the terminal, and it can be pretty hard to read:
python -m cProfile -s cumulative -m python_abc ../django
74601513 function calls (74582411 primitive calls) in 26.911 seconds
Ordered by: cumulative time
ncalls tottime percall cumtime percall filename:lineno(function)
15/1 0.000 0.000 26.911 26.911 {built-in method builtins.exec}
1 0.000 0.000 26.911 26.911 <string>:1(<module>)
1 0.000 0.000 26.911 26.911 runpy.py:200(run_module)
1 0.000 0.000 26.908 26.908 runpy.py:64(_run_code)
1 0.000 0.000 26.908 26.908 __main__.py:1(<module>)
1 0.194 0.194 26.904 26.904 __main__.py:9(main)
2749 2.614 0.001 26.290 0.010 calculate.py:139(calculate_abc)
1316825 2.176 0.000 9.288 0.000 vector.py:26(__add__)
2010083 1.126 0.000 6.266 0.000 ast.py:369(walk)
2007335 1.140 0.000 5.309 0.000 functools.py:872(wrapper)
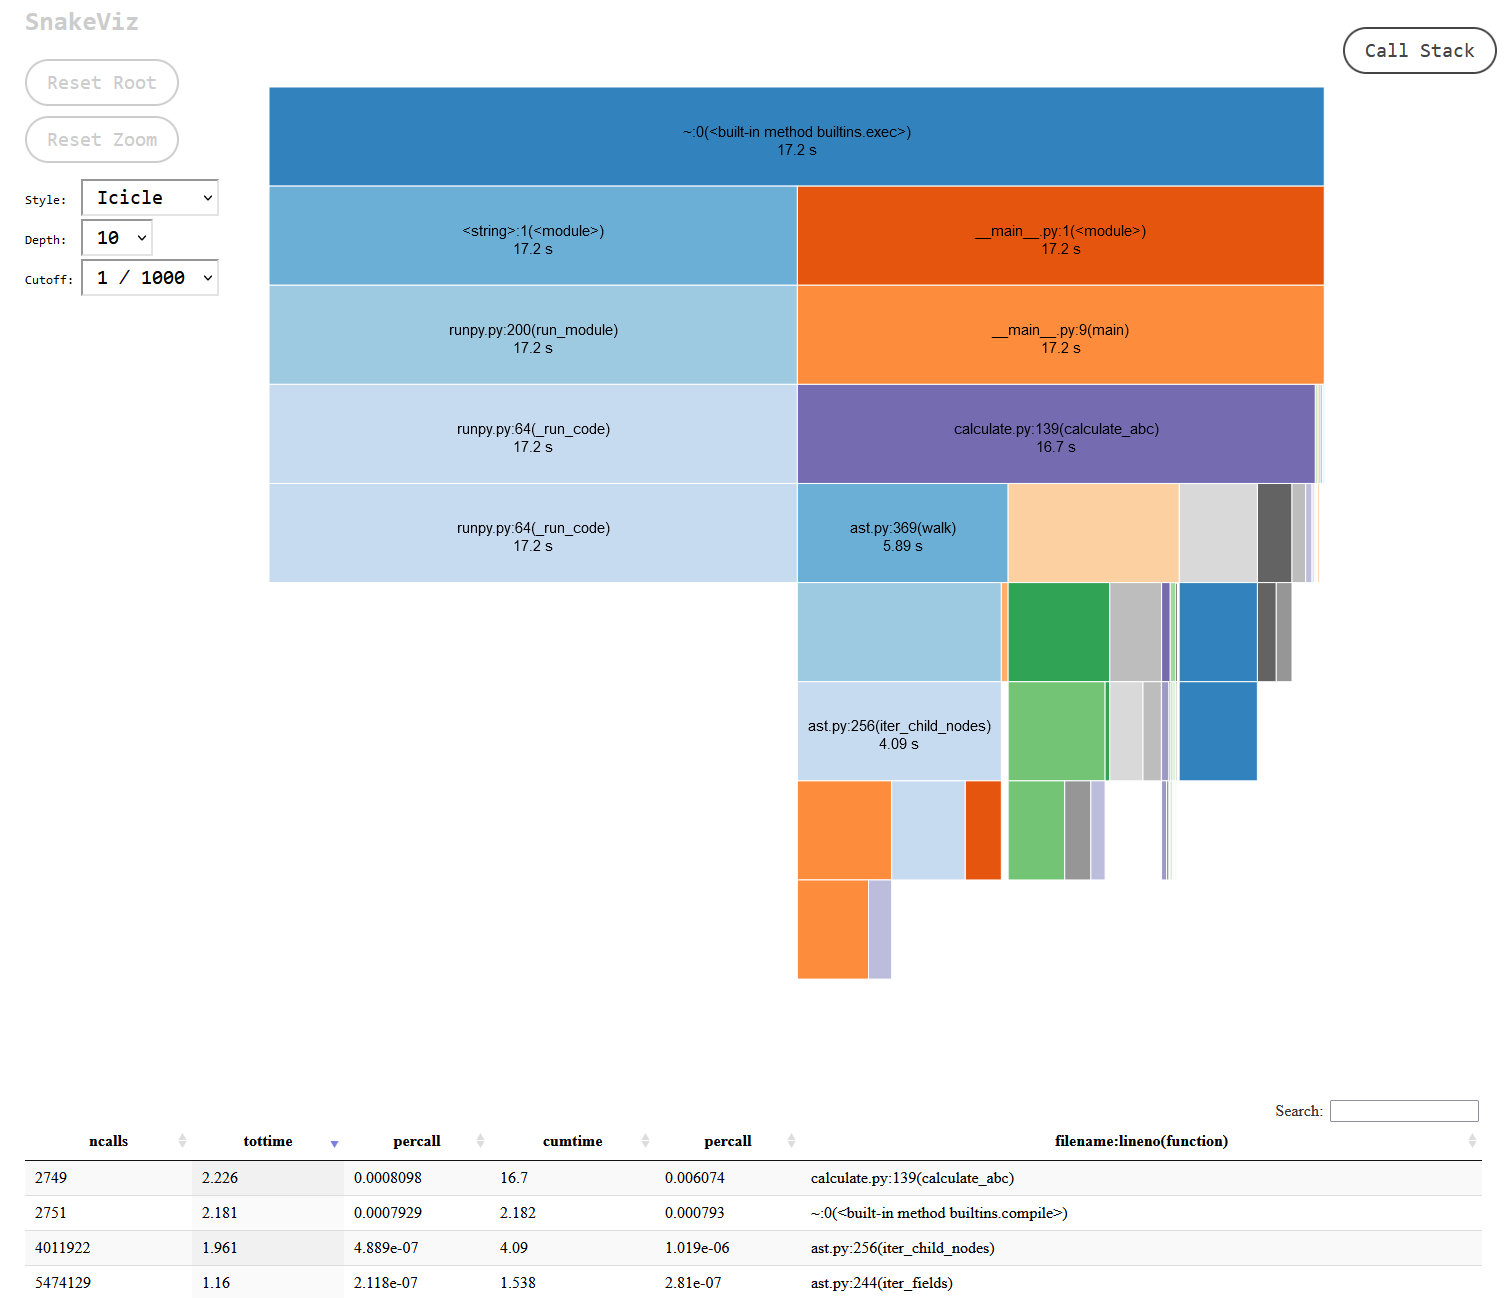
...You can see some of the overhead that the profiler is adding there, around 27 seconds with the profiler vs 13 without. The output isn’t the friendliest, but you can get around that by outputting the results to a file with -o {FILENAME}.stats (insert the FILENAME of your choice) and either working with the file directly in Python using the pstats module, or by using the snakeviz package. I can see how the former could be useful in automated regression tests that monitor performance, but the latter seems so much more useful for quick iterations and exploring the results. With a simple snakeviz {FILENAME}.stats you get a local webserver where you can interactively play with the output:
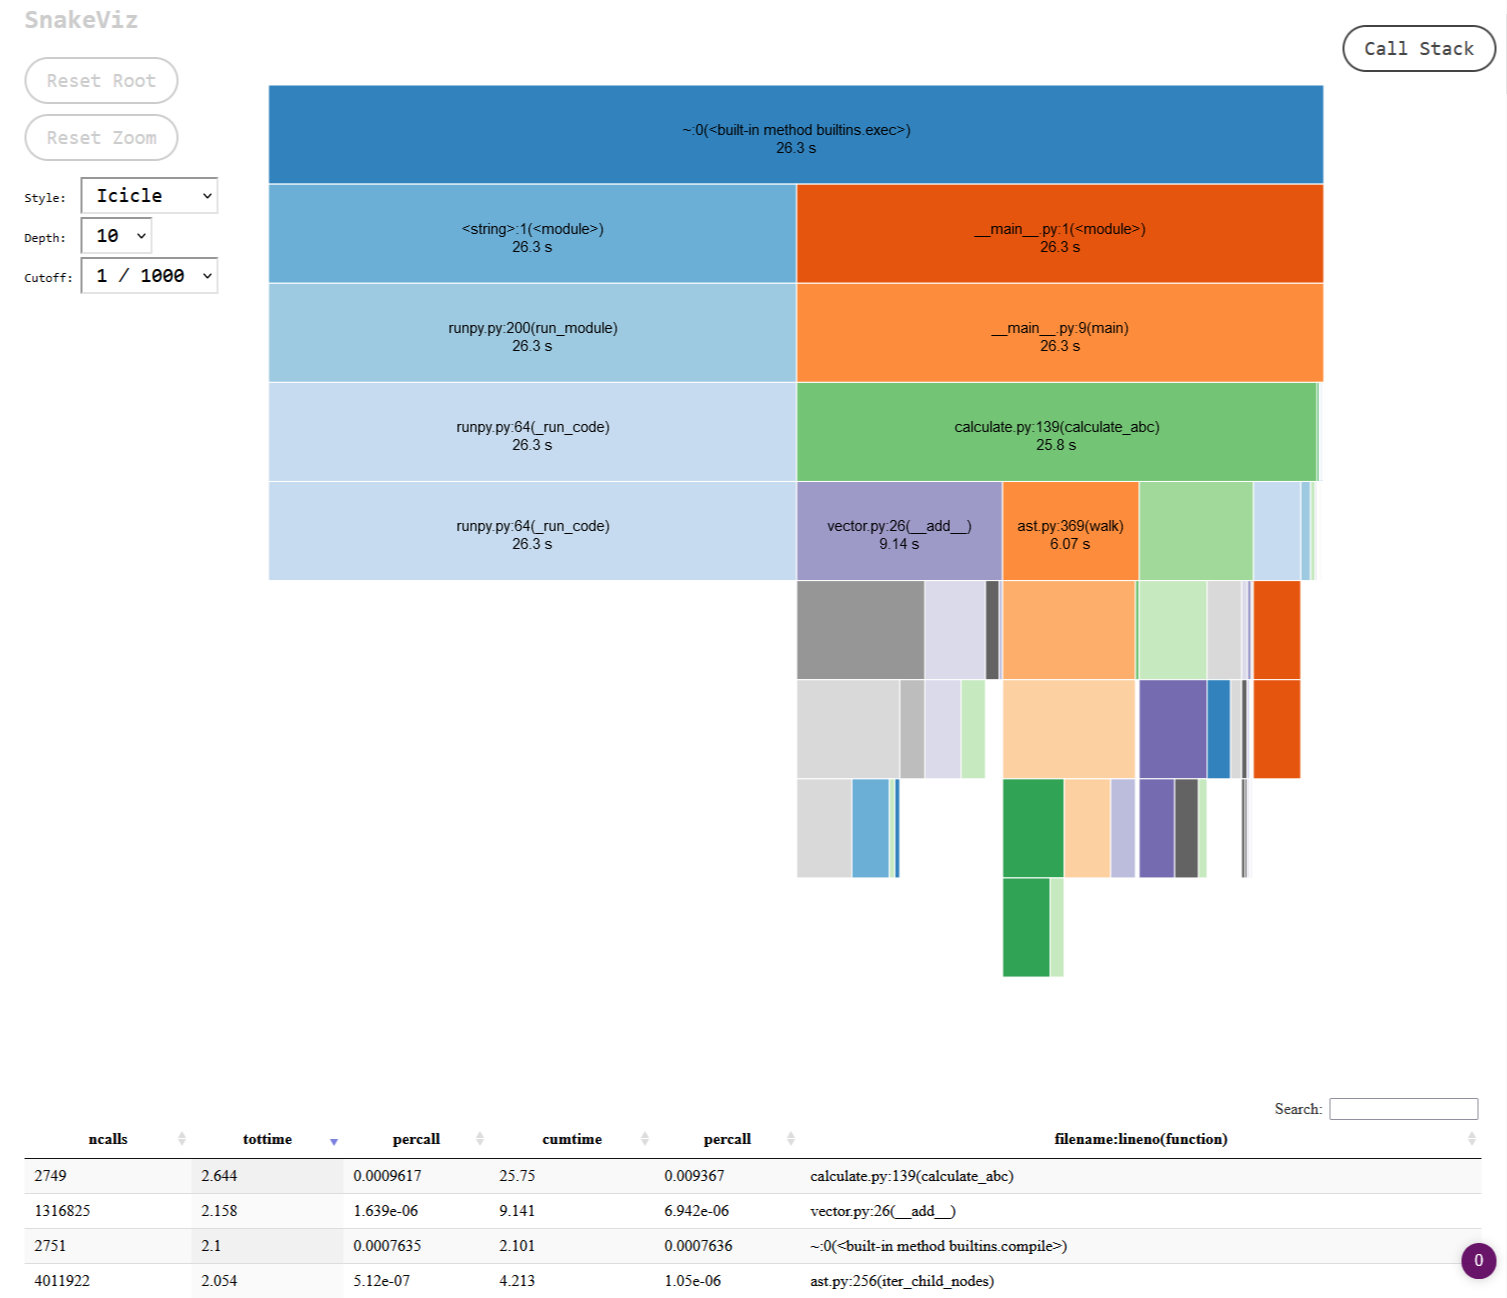
If you click on any of the sections on the page you can drill down deeper into that specific area of your code. At a glance I could immediately see that the code I wrote – vector.py – was taking up the lion’s share of the processing time, followed by Python’s ast module. As I made changes I would continually re-run cProfile and check the output in snakeviz, creating a nice, quick feedback loop.
Jump to heading (Data)Classes
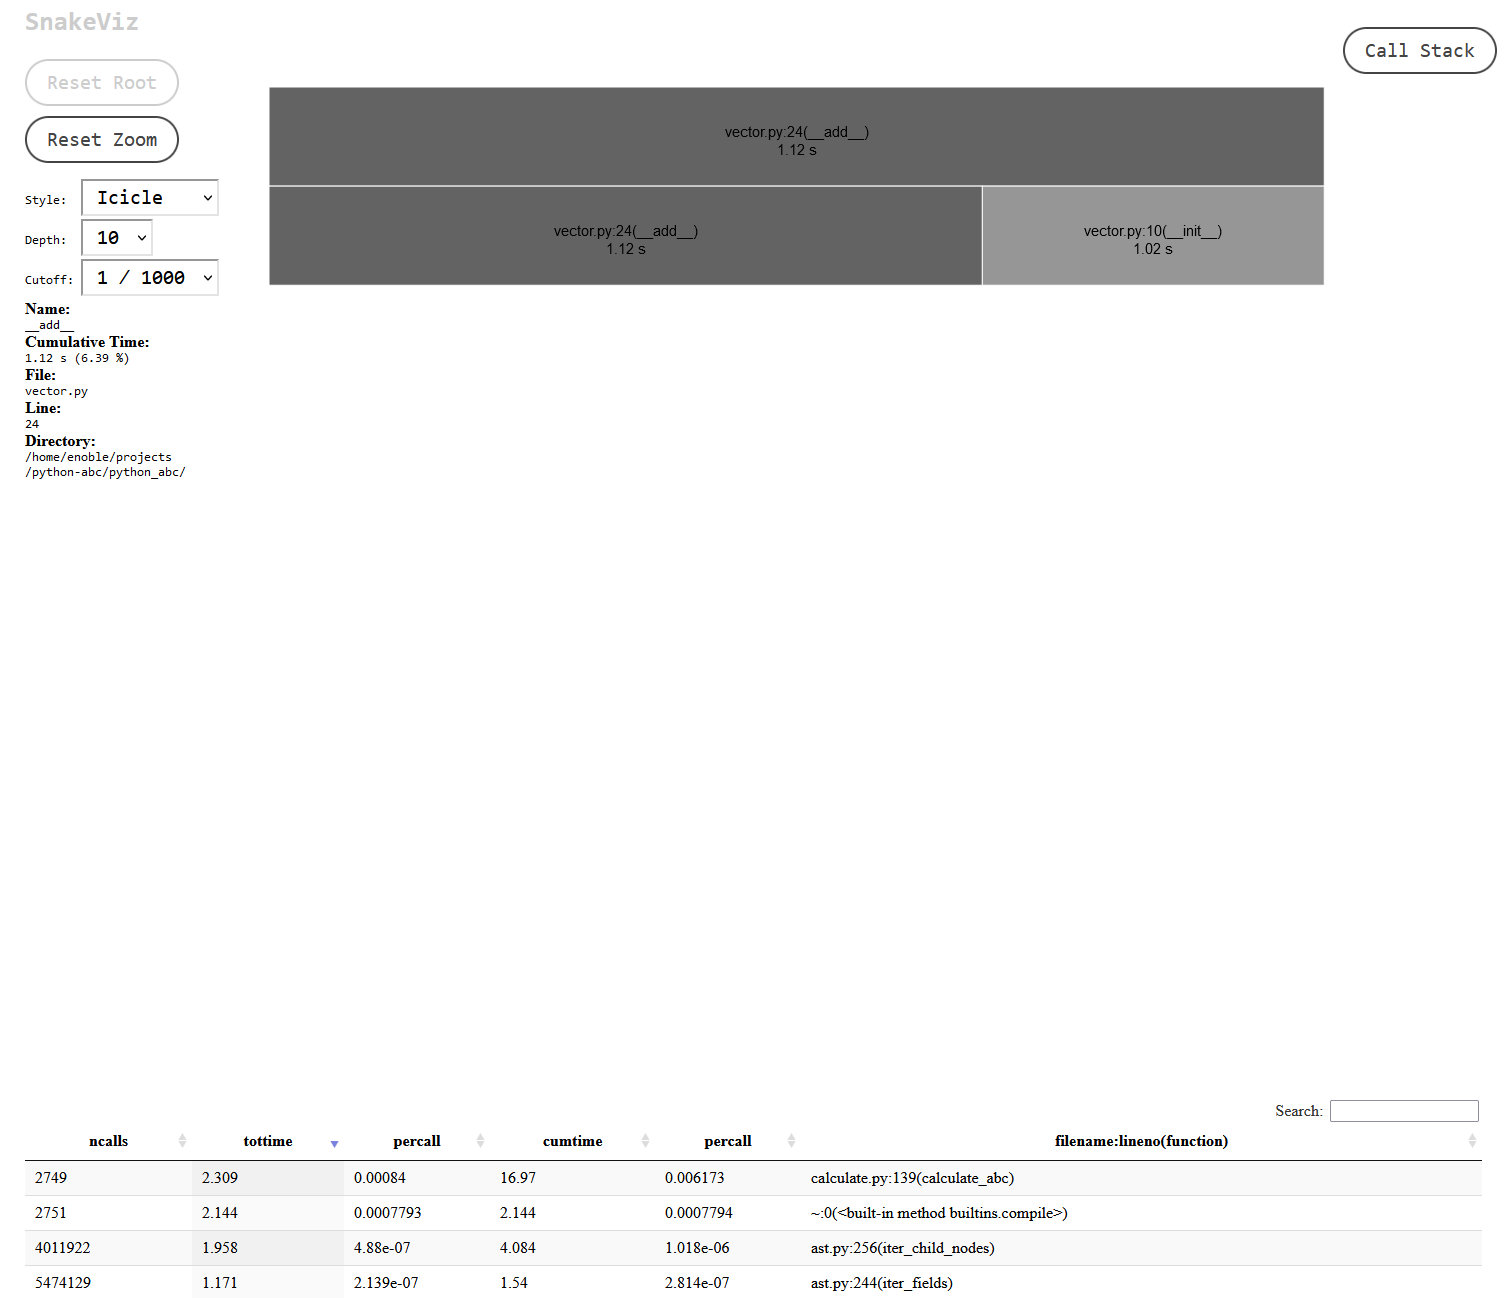
Clicking on the section for my vector.py file I could get more details on where exactly the time was being spent:
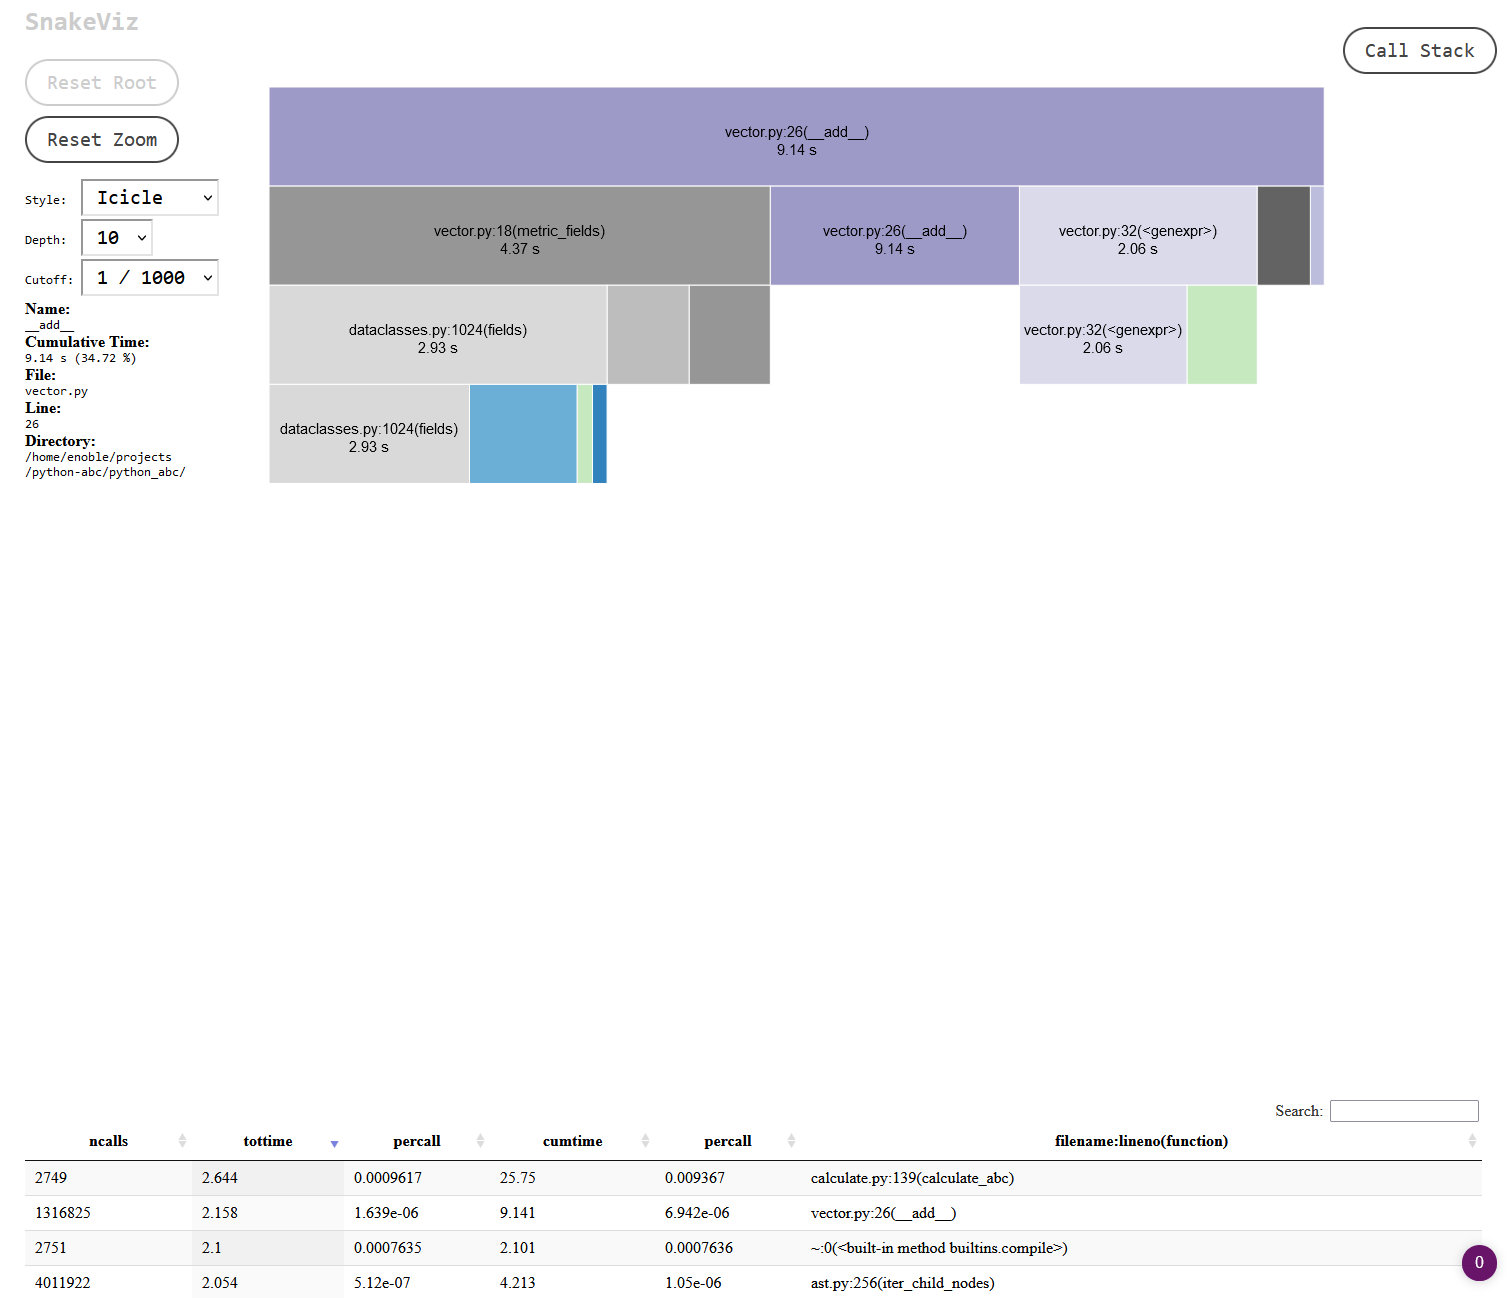
The dataclasses module looked to be doing a lot of work! Normally I would avoid trying to optimise anything from the standard library, but there was something in the back of my mind about this module maybe being a little on the slow side, so I decided to start there. When I’ve used the module in the past the quality of life improvements have usually tipped the balance for me, but in this case, since I’m creating millions of class instances, perhaps those improvements were no longer a luxury I could afford. Switching out dataclasses for native Python classes turned out to be a sizeable improvement in overall performance:
A 15% improvement overall, and an almost 50% improvement in my vector.py file:
I found this result suspicious, could the difference really be that big?. No, it turns out. I went back to review the module docs and realised I was making too many expensive calls to the fields method when I should have been calling the class attributes directly. Switching that out made the code a little less readable and less DRY but I was able to get the dataclass version of my class to be within a second of the simple class approach. This I could more easily believe, since the dataclass decorator is doing a bunch of work that a native class obviously doesn’t have to, so it’s definitely an improvement to switch to simple classes but far from a major one.
I also tried adding frozen to the decorator, which made things slower. This makes some intuitive sense since there’s probably more branch logic involved with that. I’m not running Python 3.10 yet so I wasn’t able to test the slots argument for the decorator.
Jump to heading Arrays
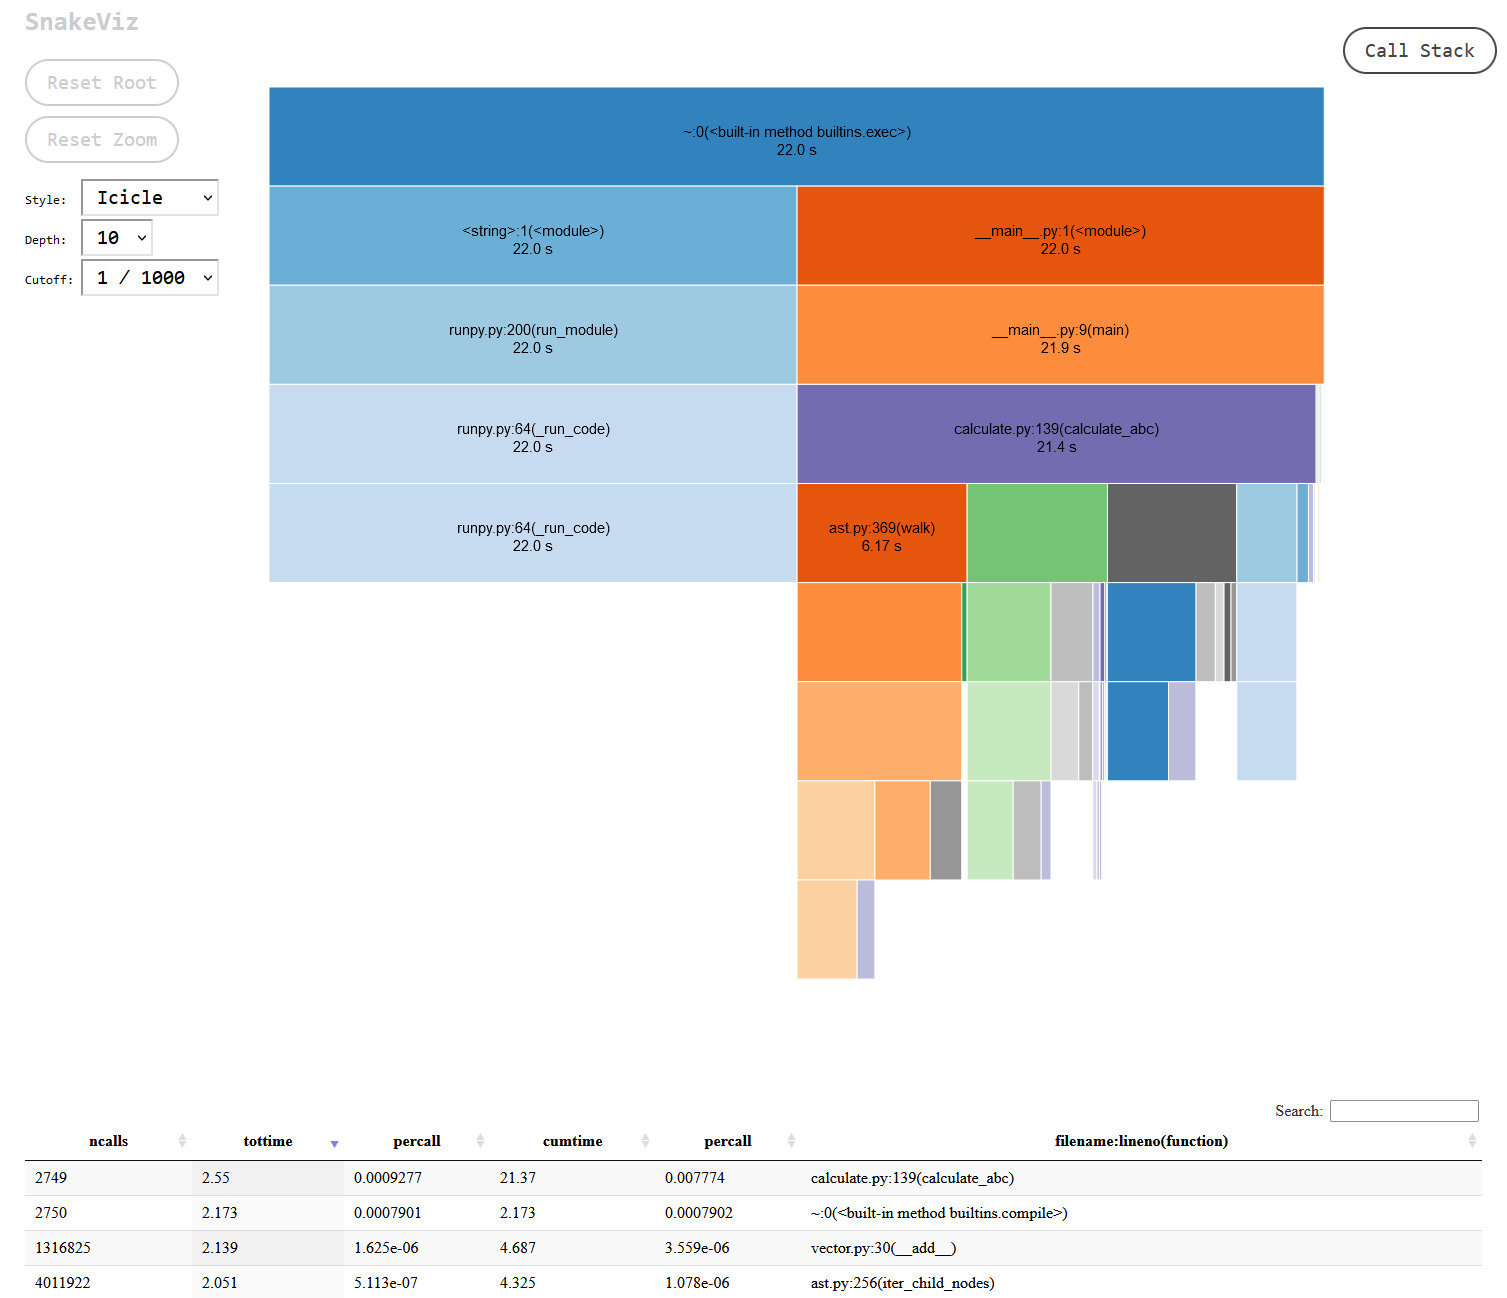
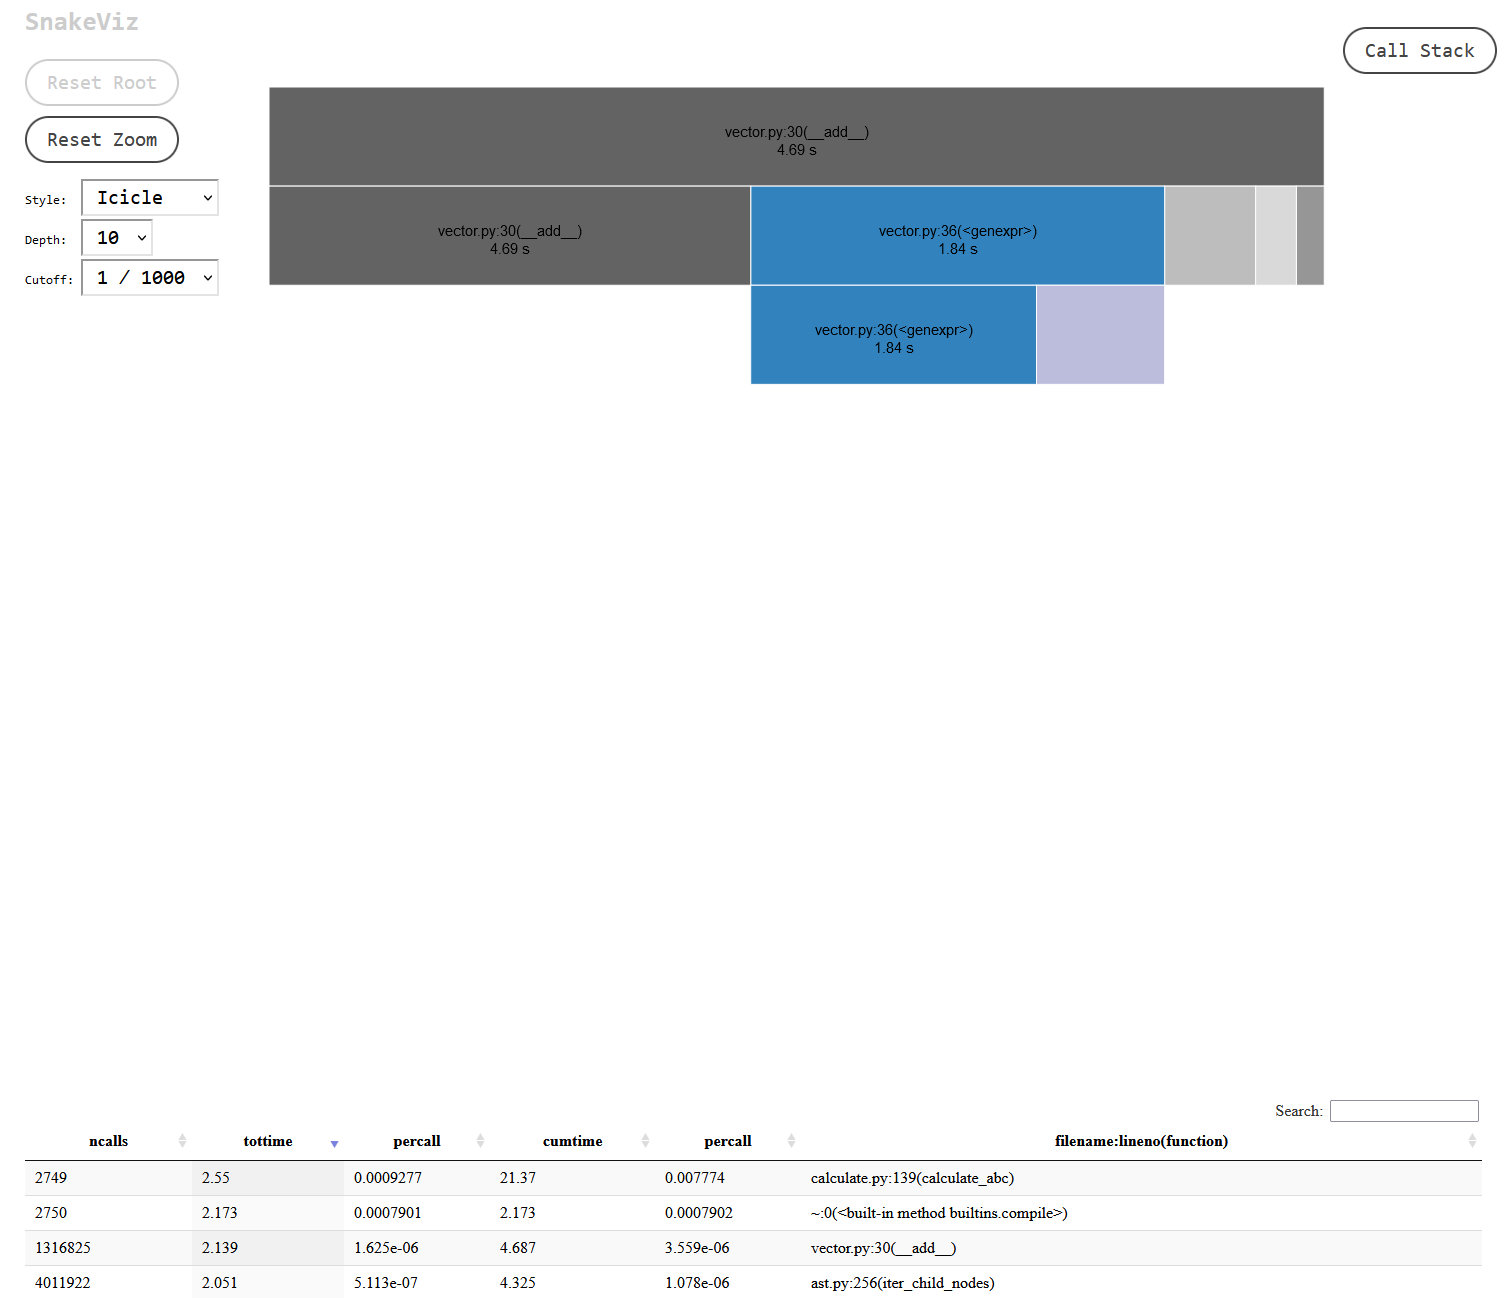
Next I started looking for needless loops during interaction with my classes and found a number of places where I was repeatedly building and looping over a list of integers, each of which was already an attribute on the class. I changed this so that the class accessed the attributes directly instead of interacting with lists over and over again. This had an even bigger impact on performance than I’d expected:

A further 20% improvement overall, and an over 75% improvement in my vector.py file:
This made sense after reading High Performance Python – I was looping over these arrays in a number of places, which is always going to be slower than looking up an attribute on the class, and repeatedly creating the arrays was incurring a small memory allocation cost every time as well.
Tuples would have been a better choice than lists in this case, since the array was never changing and tuples are apparently cached by Python at runtime (TIL, this StackOverflow post has more details), but having no array at all is always going to come out ahead. Again, if I weren’t building so many arrays then I might have considered leaving them in for readability, but at this scale they were clearly a big problem.
Jump to heading Slots
I’d read that adding __slots__ to your class can be a performance improvement in terms of memory, presumably because you can make a class instance more memory-efficient if you know that it is of a fixed size, the same reason a tuple takes up less memory than a list. When I tested my code with the memory_profiler package I saw only a minor improvement in terms of memory usage, unfortunately. I’m not 100% confident in the result, though, since there are a lot of open issues on the project and it’s no longer being actively maintained. Having said that, the classes in question are very small, no more than a dozen attributes, so perhaps they weren’t requiring a lot of memory in the first place. More surprising to me was a small CPU performance improvement:
I’d have thought class attribute lookups would be constant-time either way, so maybe memory allocation ended up being a little faster? Two percent probably isn’t statistically significant, though.
Jump to heading Parallelisation
My library scans an arbitrary number of files and then prints out the results. This is an example of what the authors of High Performance Python refer to as an “embarrassingly parallel” problem because no data is shared between each task:
an algorithm can be analyzed to see how well it’ll perform in a parallel environment almost entirely by how much state must be shared. For example, if we can have multiple Python processes all solving the same problem without communicating with one another (a situation known as embarrassingly parallel), not much of a penalty will be incurred as we add more and more Python processes.
This means that the biggest performance improvement I could make in this case was probably not going to be related to my code itself, although that’s certainly helpful as demonstrated above. The biggest improvement was going to come from running the key portions of my code in parallel.
The High Performance Python authors recommended the joblib library for this, which I’d never come across before but certainly looked more approachable than Python’s multiprocessing module. It seems actively maintained and doesn’t introduce any mandatory additional dependencies, which was a nice bonus. To someone like me who is familiar with asyncio it looks to have a promise-like structure that I find pretty readable, so my original code:
output: List[Tuple[str, Optional[Vector], float]] = []
for filename in files:
    with open(filename, "r") as f:
        source = f.read()

        try:
            abc_vector = calculate_abc(source, args["debug"], args["verbose"])
        except SyntaxError:
            output.append((filename, None, 0.0))
        else:
            output.append((filename, abc_vector, abc_vector.get_magnitude_value()))
required only some small tweaks to become parallelised:
def analyze_file(filename):
    with open(filename, "r") as f:
        source = f.read()

        try:
            abc_vector = calculate_abc(source, args["debug"], args["verbose"])
        except SyntaxError:
           return (filename, None, 0.0)
        else:
            return (filename, abc_vector, abc_vector.get_magnitude_value())

output = Parallel(n_jobs=args["cores"])(
    delayed(analyze_file)(filename) for filename in files
)
This brought my non-profiled runtime down from ~13 seconds to around two seconds, an almost 85% speed improvement without any downsides that I can see! Of course not every problem is as “embarrassingly parallel” as this one, but for those that are then something like joblib seems a no-brainer.
With hindsight maybe I should have gone straight to looking for opportunities to run the expensive parts of my code in parallel, but I deliberately wanted to follow the different methodologies laid out in High Performance Python, and to familiarise myself with the tools that are available. I should write up a review of the book at some point but I very much recommend it, especially if your code does a lot of number crunching. Happy profiling!